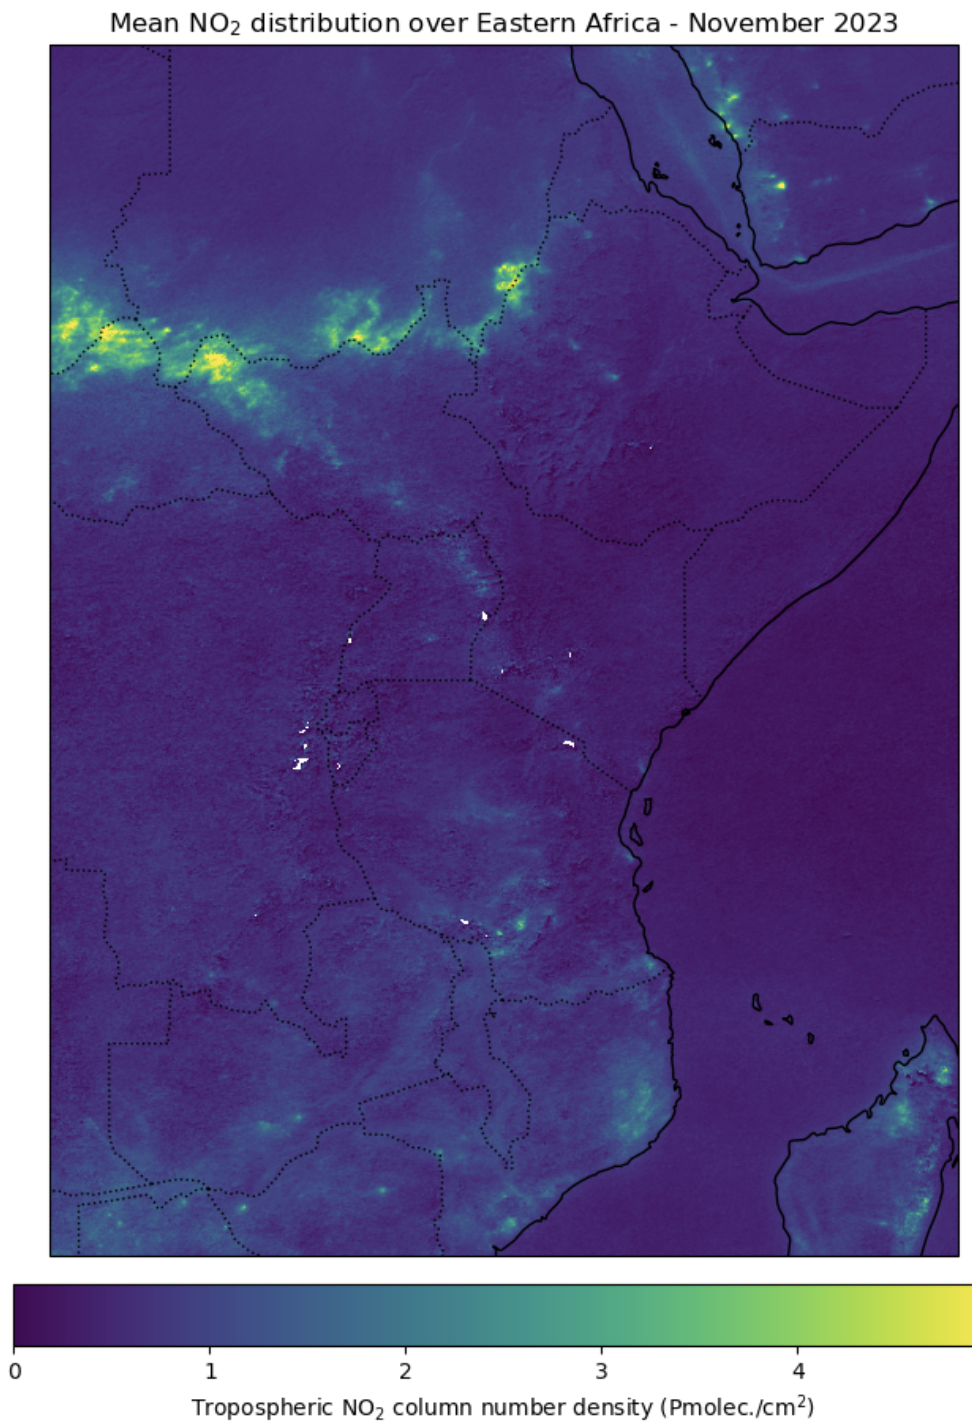
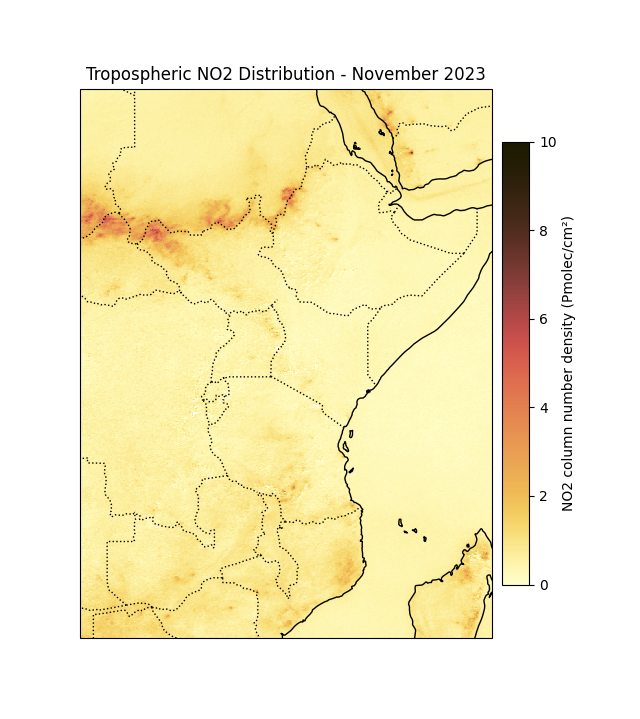
With a simple Python code you may plot the monthly average of NO2 over eastern Africa. By modifying the code you may change the period, covered area and colorscales as shown with two images below.


You may download L3 data covering longer time period, like monthly files for one year, using the bash shell scripts. There are two versions, one if you have s3cmd installed and one without.
The syntax is as: bash download_l3_s3tropomi.sh no2-l3 daily 2020-06-01 2020-07-01
where no2-l3 is the variable (no2-l3, co-l3, ch4-l3, so2-l3 or o3-l3), daily is the type of the L3 (daily, monthly or yearly) and then start and end dates of the needed period as YYYY-MM-DD.
The version With s3cmd (download_l3_s3tropomi.sh)
The version without s3cmd (download_l3_tropomi.sh)
Please note that both versions use the awk command and the without s3cmd version use also curl and grep. The grep has to allow -P option and thus, should be full GNU version (for example, ggrep in Macs)