

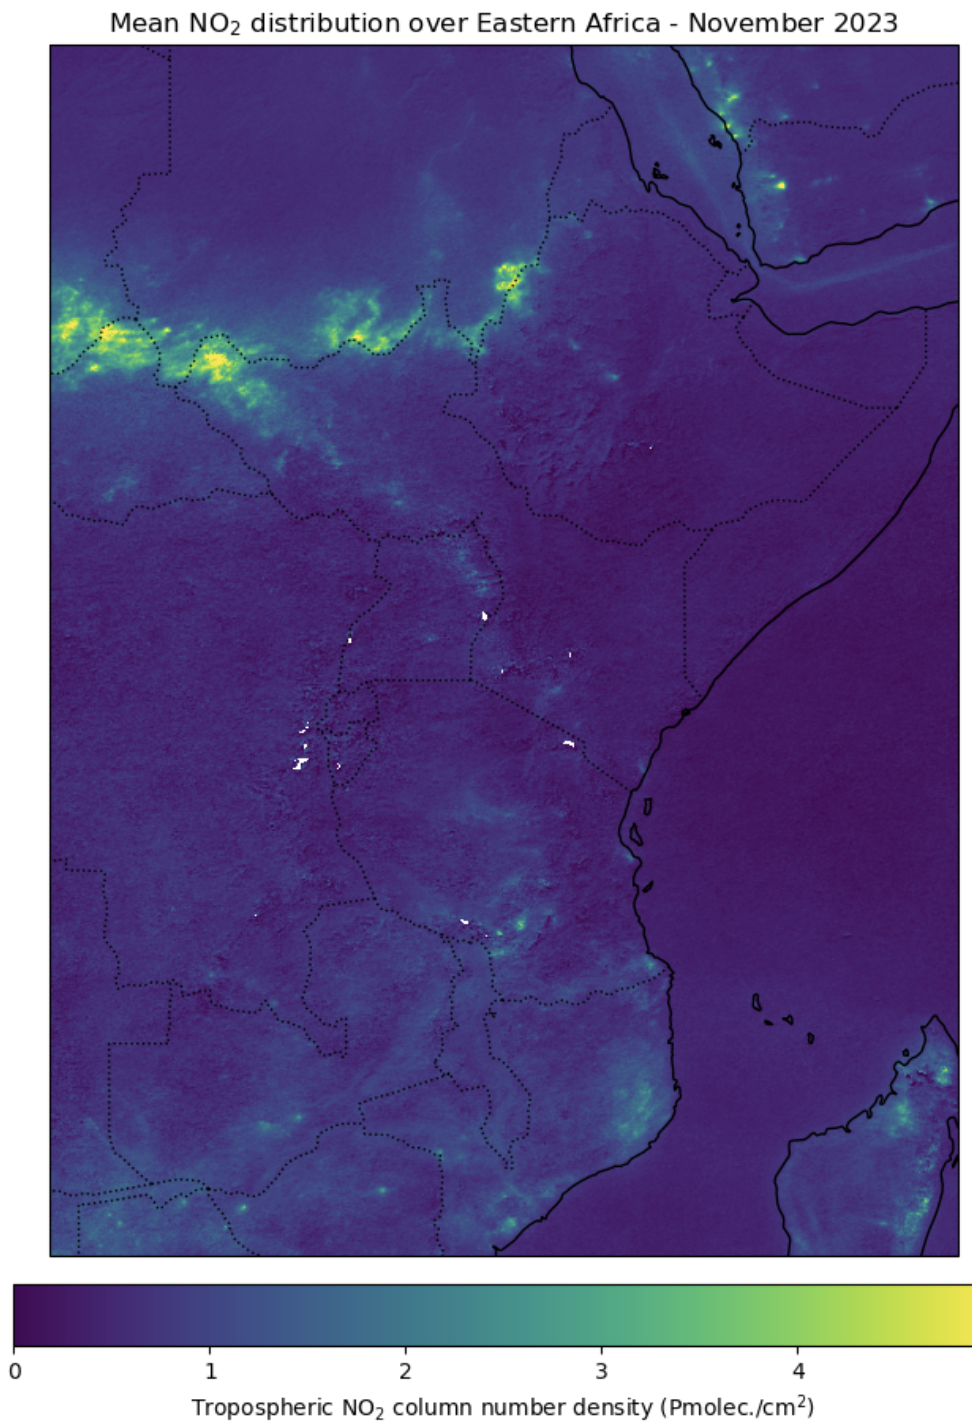
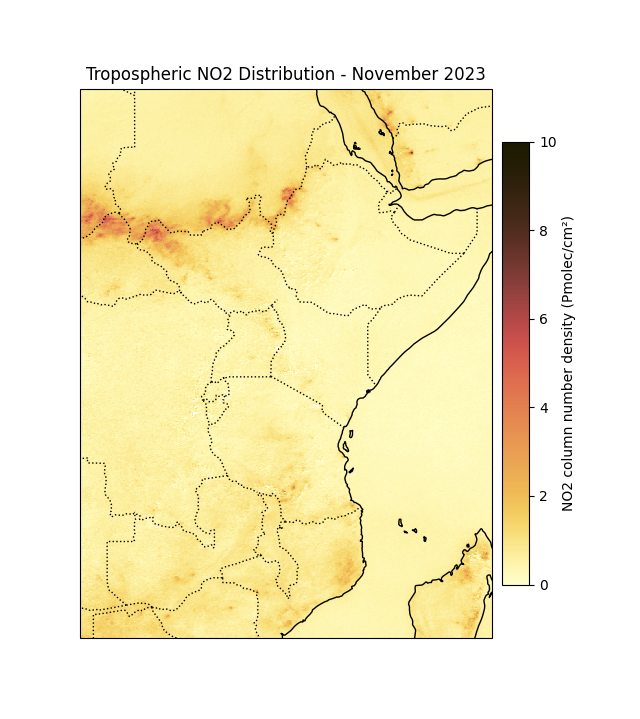
With a simple Python code you may plot the monthly average of NO2 over eastern Africa. By modifying the code you may change the period, covered area and colorscales as shown with two images below.
Download the monthly png images using the script bash download_l3_tropomi_image.sh sif-l3 monthly 2024-01-01 2025-12-01
Then use ffmpeg or similar tool to create a video. Here is example with ffmpeg when the video width is not divible with 2: ffmpeg -r 1 -pattern_type glob -i '*.png' -c:v libx264 -pix_fmt yuv420p -r 10 -vf pad=\"width=iw+1:height=ih:x=0:y=0:color=white\" output.mp4
And the result is here
You may download L3 data covering longer time period, like monthly files for one year, using the bash shell scripts. There are two versions, one if you have s3cmd installed and one without.
The syntax is as: bash download_l3_s3tropomi.sh no2-l3 daily 2020-06-01 2020-07-01
where no2-l3 is the variable (no2-l3, co-l3, ch4-l3, so2-l3, o3-l3, sif_l3 or hcho_l3), daily is the type of the L3 (daily, monthly or yearly) and then start and end dates of the needed period as YYYY-MM-DD. Change also the anme of the script depending your system - with s3cmd or without.
The version With s3cmd (download_l3_s3tropomi.sh)
The version without s3cmd (download_l3_tropomi.sh)
Please note that both versions use the awk command and the without s3cmd version use also curl and grep. The grep has to allow -P option and thus, should be full GNU version (for example, ggrep in Macs)
And finally, we appreciate it if you are providing acknowledgements, for example: The TROPOspheric Monitoring Instrument (TROPOMI) is co-funded by ESA and NSO and it is on board the Copernicus Sentinel-5 Precursor satellite. ESA has provided the L2 data and FMI has generated the L3 images and data files.
You may download L3 images in a same way as the data using the bash shell scripts. There are two versions, one if you have s3cmd installed and one without.
The syntax is as: bash download_l3_s3tropomi_image.sh no2-l3 daily 2020-06-01 2020-07-01
where no2-l3 is the variable (no2-l3, co-l3, ch4-l3, so2-l3, o3-l3, sif_l3 or hcho_l3), daily is the type of the L3 (daily, monthly or yearly) and then start and end dates of the needed period as YYYY-MM-DD. Change also the name of the script depending your system - with s3cmd or without.
The version With s3cmd (download_l3_s3tropomi_image.sh)
The version without s3cmd (download_l3_tropomi_image.sh)
Please note that both versions use the awk command and the without s3cmd version use also curl and grep. The grep has to allow -P option and thus, should be full GNU version (for example, ggrep in Macs)
One example where two years of monthly SIF images have been downloaded and then a mp4 video created with ffpeg is above under Simple monthly SIF animation for years 2024-2025 item.
And finally, we appreciate it if you are providing acknowledgements, for example: The TROPOspheric Monitoring Instrument (TROPOMI) is co-funded by ESA and NSO and it is on board the Copernicus Sentinel-5 Precursor satellite. ESA has provided the L2 data and FMI has generated the L3 images and data files.